

Buyers
Closing Disclosure Explained: How to Read It Line by Line
Closing disclosure explained in plain English: when you get it, how to compare it with your Loan Estimate, and what to question before closing day.
Read more →
If you are watching the Thompson’s Station TN housing market, the numbers come from several places, and they do not always line up. Redfin, Zillow and Realtor.com each measure things a little differently.
Here is what each source shows right now, with dates, and how to read the numbers without overreading them. You can also see the town’s figures on the Thompson’s Station housing market data page.
City-level numbers come from the Redfin Data Center. For Thompson’s Station, Redfin’s rolling 3-month figures as of September 30, 2026 are:
Sale-to-list is the sale price compared with the list price. At 99.0%, the average home in this window sold for about one percent under its list price.
Months of supply is how long it would take to sell every active listing at the current pace of sales. A common guide is that under 4 months favors sellers, 4 to 6 months is balanced, and over 6 months favors buyers. At 5.8, Thompson’s Station sits in the balanced range, just under the line for buyers.
For context, Redfin reports the following for the Nashville metro area for the 4 weeks ending November 1, 2026:
A few cautions. The Thompson’s Station figures cover a rolling 3 months ending September 30. The metro figures cover 4 weeks ending November 1. The time windows differ, and the town figure for sale-to-list is an average, so treat the comparison as a rough one.
Still, the pattern is worth noting. Months of supply and days on market are close between the two. The median sale price is not. Conditions can differ a lot between cities, price ranges and neighborhoods, which is why local data tells you more than a national headline. For a wider view, see the Nashville housing market data page.

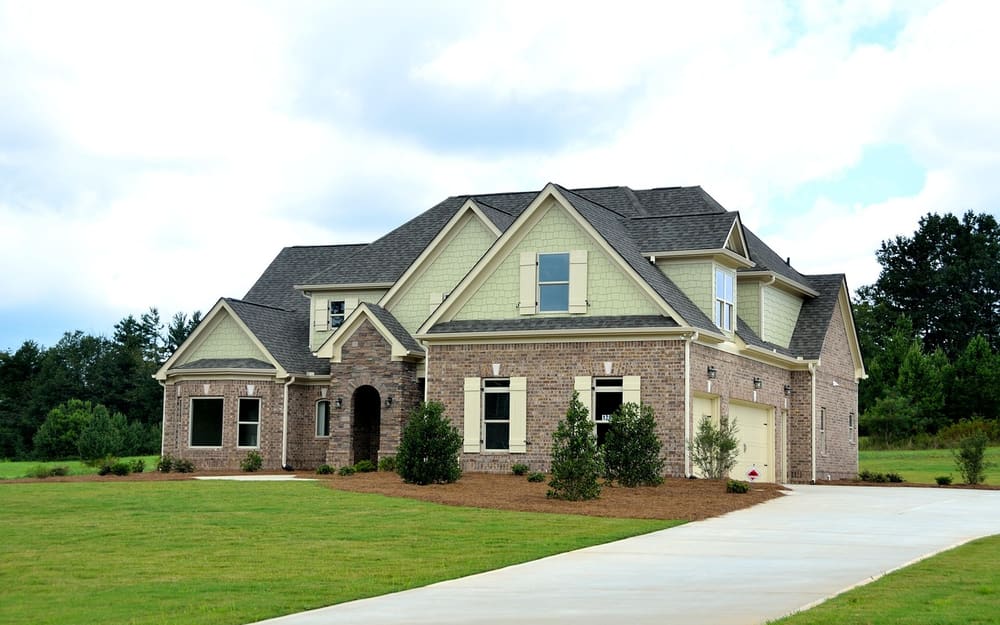
Photo by Giovanni_cg on Pixabay
The other two sources use their own scores.
Zillow. The Zillow Market Temperature Index for Thompson’s Station is 25, according to Zillow Research. The trend is listed as cooling, with the index down 21 over 3 months. The data I have does not give a reporting date for this figure, so check Zillow’s site for the current reading.
Realtor.com. Realtor.com Research gives Williamson County a hotness score of 40.5 out of 100. That is a county figure, not a Thompson’s Station figure, and the reporting date is not included in the data I have either.
Our own data files also label Thompson’s Station overall as a buyer’s market. I do not have the method behind that label, so I would not read it as a verdict. By the months of supply guide above, 5.8 falls in the balanced range. When one label and one measure seem to disagree, look at the underlying numbers: days on market, sale-to-list and months of supply.
None of these numbers predict what prices or rates will do next. They describe recent sales and current listings.
A few ways to use them:
Price range matters too. A town-wide median blends many types of homes, so the conditions for the home you care about may differ.
This is general information, not advice.
If you are buying, the 30-year fixed mortgage rate was 7.18% for the week of November 5, 2026, according to Freddie Mac via FRED. Nobody can reliably predict where rates will go, so waiting for a lower rate is a bet in either direction. Many buyers focus on readiness instead: stable income, an emergency fund after closing, and a payment that fits comfortably. You can test payments with the mortgage calculator.
Buyers can also ask about negotiating, such as asking a seller to cover some closing costs or fund a rate buydown. Whether that is available depends on the seller, the home and the market, and a lender must confirm what is allowed for your loan. Closing costs typically run 2 to 4 percent of the purchase price, plus earnest money and moving costs.
If you are selling, pricing is the main decision your market data can inform. Look at recent sales for homes like yours rather than the town-wide median. Days on market and sale-to-list show how the town has behaved overall, but your home’s result will depend on its own details.
School assignment and property taxes depend on the exact address. For any home you are serious about, verify both with the school district and the county.
Nearby towns can look quite different from one another. If you are comparing, the Franklin housing market data and Spring Hill housing market data pages sit alongside this one. Spring Hill includes parts of both Williamson and Maury counties, so services and taxes can differ by address there.
If you want to look at what these numbers mean for a specific plan, I am happy to talk. I am Scott Davis, a REALTOR® with Hive Nashville.
Buyers can use Get matched with homes. After you fill out the form, I schedule a call and we will be talking within the next 48 hours. If you own a home, find out what your home is worth to start that conversation.
Redfin reports a median sale price of $833,246 for Thompson's Station, up 1.7% from a year earlier. That is a rolling 3-month figure as of September 30, 2026.
Redfin shows a median of 65 days on market for Thompson's Station, in a rolling 3-month window as of September 30, 2026. Individual homes can sell faster or slower.
Months of supply is how long it would take to sell every active listing at the current pace of sales. Under 4 months favors sellers, 4 to 6 is balanced, and over 6 favors buyers. Redfin shows 5.8 for Thompson's Station as of September 30, 2026.
Freddie Mac, via FRED, reported a 30-year fixed rate of 7.18% for the week of November 5, 2026. Rates vary by lender and borrower, so compare Loan Estimates.
Thompson's Station real estate guideHousing marketHome pricesSelling in Thompson's Station
Nashville real estate guideHousing marketHome pricesSelling in Nashville
Tell me your budget, area and timeline, and we'll be talking within the next 48 hours.
Closing disclosure explained in plain English: when you get it, how to compare it with your Loan Estimate, and what to question before closing day.
Read more →
See what Redfin, Zillow and Realtor.com currently show for the Murfreesboro TN housing market, including days on market, months of supply and price trends.
Read more →
Federal Reserve mortgage rates explained: what the Fed does and doesn't control, what else shapes your rate, and how to plan as a Middle Tennessee buyer.
Read more →