

Market Update
September 2026 Housing Market Report: Franklin, Brentwood, Spring Hill and More
A city-by-city look at prices, days on market and inventory along the I-65 corridor, with sources and dates, through September 30, 2026.
Read more →
Here is where the market stands along the I-65 corridor and in greater Nashville, based on data through October 31, 2026.
The average 30-year fixed mortgage rate was 7.18% (week of November 5, 2026).
How to read it: each rating blends Zillow’s Market Temperature Index, Redfin’s months of supply and Realtor.com’s county data. Blended from up to three sources: Zillow’s Market Temperature Index (55%), Redfin months of supply (30%) and Realtor.com county hotness (15%).
Zillow Market Temperature Index: Buyer’s | Redfin months of supply: Balanced | Realtor.com Williamson County: Cool | Trend: steady | The sources disagree
As of October 31, 2026, Franklin’s market leans toward buyers, though the sources disagree. Zillow’s Market Temperature Index is 31 (Buyer’s), Redfin’s months of supply is 4.1 (Balanced), and Realtor.com’s Williamson County hotness score is 40.5 of 100 (Cool). The median sale price is $849,409, up 5.5% from a year earlier, with a median of 61 days on market.
Zillow Market Temperature Index: Strong buyer’s | Redfin months of supply: Balanced | Realtor.com Williamson County: Cool | Trend: cooling | The sources disagree
Brentwood is rated a buyer’s market as of October 31, 2026, though the sources disagree. Zillow’s Market Temperature Index is 20 (strong buyer’s), Redfin shows 5.6 months of supply (balanced), and Realtor.com rates Williamson County 40.5 of 100 (cool). The median sale price is $1,281,609, down 4.1% from a year earlier, and homes took a median of 62 days to sell.

Zillow Market Temperature Index: Strong buyer’s | Redfin months of supply: Balanced | Realtor.com Maury County: Cool | Trend: cooling | The sources disagree
Spring Hill is rated a buyer’s market as of October 31, 2026, based on rolling 3-month figures. The sources disagree: Zillow’s index of 17 reads strong buyer’s, Redfin’s 4.5 months of supply reads balanced, and Realtor.com’s Maury County score of 35.4 out of 100 reads cool. The median sale price was $501,321, down 9.7% from a year earlier, and Zillow’s index fell 11 points over three months.
Zillow Market Temperature Index: Strong buyer’s | Redfin months of supply: Balanced | Realtor.com Williamson County: Cool | Trend: cooling | The sources disagree
Thompson’s Station is rated a buyer’s market as of October 31, 2026, though the sources disagree. Zillow’s Market Temperature Index is 25 (strong buyer’s), Redfin’s months of supply is 5.6 (balanced), and Realtor.com’s Williamson County reading is 40.5 of 100 (cool). The median sale price is $852,937, down 5.2% from a year earlier, with a median of 83 days on market.
Zillow Market Temperature Index: Buyer’s | Redfin months of supply: Seller’s | Realtor.com Williamson County: Cool | Trend: steady | The sources disagree
Nolensville is rated a balanced market as of October 31, 2026, though the sources disagree noticeably. Zillow’s Market Temperature Index of 41 reads as buyer’s, Redfin’s 2.9 months of supply reads as seller’s, and Realtor.com’s Williamson County hotness score of 40.5 out of 100 reads as cool. The median sale price was $969,326, down 8.6% from a year earlier, and with only 73 active listings, the figures can swing from month to month.
Zillow Market Temperature Index: Strong buyer’s | Redfin months of supply: Buyer’s | Realtor.com Davidson County: Cool | Trend: cooling
Nashville is rated a buyer’s market as of October 31, 2026, based on rolling 3-month figures. Zillow’s Market Temperature Index is 23 (strong buyer’s), Redfin shows 6.5 months of supply (buyer’s), and Realtor.com rates Davidson County as cool at 19.1 of 100. The median sale price is $457,132, down 3.8% from a year earlier, and Zillow’s index has moved down 9 points over three months.
Zillow Market Temperature Index: Buyer’s | Redfin months of supply: Balanced | Realtor.com Maury County: Cool | Trend: heating
As of October 31, 2026, Columbia’s market leans toward buyers, based on rolling 3-month figures. Zillow’s index of 32 reads Buyer’s, Redfin’s 5.0 months of supply reads Balanced, and Realtor.com’s Maury County hotness score of 35.4 reads Cool, so the sources do not fully agree. Zillow’s index rose 11 points over three months, and the median sale price of $354,753 is down 1.4% from a year earlier.
Zillow Market Temperature Index: Strong buyer’s | Redfin months of supply: Balanced | Realtor.com Rutherford County: Cool | Trend: cooling | The sources disagree
As of October 31, 2026, Murfreesboro’s overall rating leans toward buyers, though the sources disagree. Zillow’s Market Temperature Index is 23 (strong buyer’s) and Realtor.com’s Rutherford County hotness is 36.4 of 100 (cool), while Redfin shows 4.5 months of supply (balanced). Zillow’s index moved down 22 points over three months, and the median sale price is $426,703, down 2.5% from a year earlier.
A recent public statement about housing and mortgage rates, in the speaker’s own words:
“Our short-term policy rates affect longer-term borrowing rates, including those for mortgages, but many other things affect mortgage rates as well.”
— Michael S. Barr, Federal Reserve Governor, in a speech on September 23, 2026 (Federal Reserve)
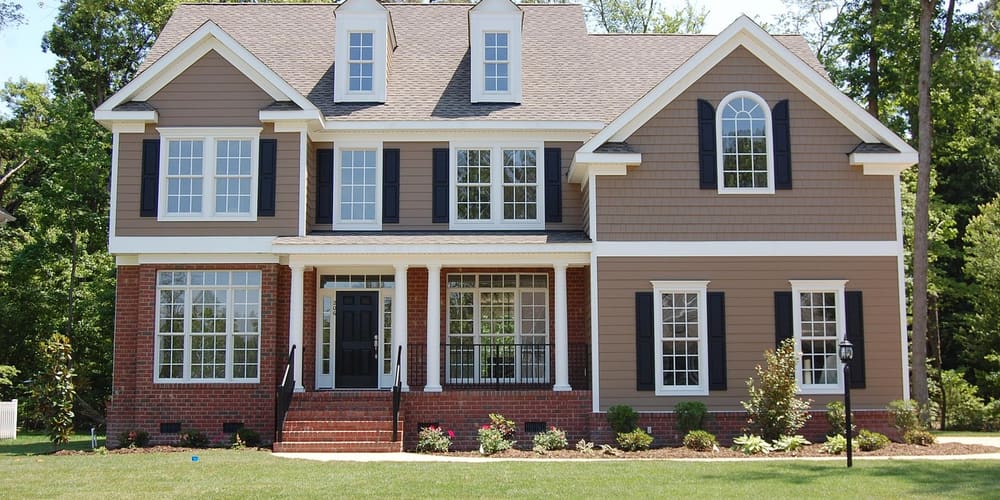
Photo by KellyAlpert on Pixabay
Every home and neighborhood is different. If you would like to talk through what these numbers mean for you, get matched with homes, find out what your home is worth or contact me. You can also see live numbers for every city on the market data page, or try your own numbers in the mortgage calculator.
Sources: Redfin Data Center (median sale price, median price per square foot, days on market, sale-to-list ratio, inventory and months of supply, as rolling 3-month figures); Freddie Mac via FRED, Federal Reserve Bank of St. Louis (30-year fixed mortgage rate, weekly); Zillow Research (Market Temperature Index); Realtor.com Research (county hotness and listing activity). Conditions vary by neighborhood, price range and home type. This is general information, not legal, tax, lending or financial advice.
Franklin real estate guideHousing marketHome pricesBuying in Franklin
Brentwood real estate guideHousing marketHome pricesBuying in Brentwood
Spring Hill real estate guideHousing marketHome pricesBuying in Spring Hill
Tell me your budget, area and timeline, and we'll be talking within the next 48 hours.
A city-by-city look at prices, days on market and inventory along the I-65 corridor, with sources and dates, through September 30, 2026.
Read more →A city-by-city look at prices, days on market and inventory along the I-65 corridor, with sources and dates, through August 31, 2026.
Read more →
See what Redfin, Zillow and Realtor.com data shows for the Thompson's Station TN housing market, from months of supply to days on market.
Read more →